
Page 61 - Book3E
P. 61
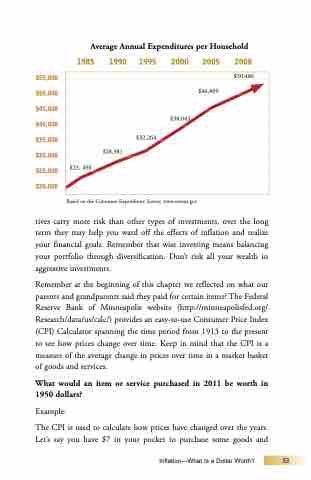
$23, 490
Average Annual Expenditures per Household
1985 1990 1995
2000 2005 2008
 $55,000 $50,000 $45,000 $40,000 $35,000 $30,000 $25,000 $20,000
tives carry more risk than other types of investments, over the long term they may help you ward off the effects of inflation and realize your financial goals. Remember that wise investing means balancing your portfolio through diversification. Don’t risk all your wealth in aggressive investments.
Remember at the beginning of this chapter we reflected on what our parents and grandparents said they paid for certain items? The Federal Reserve Bank of Minneapolis website (http://minneapolisfed.org/ Research/data/us/calc/) provides an easy-to-use Consumer Price Index (CPI) Calculator spanning the time period from 1913 to the present to see how prices change over time. Keep in mind that the CPI is a measure of the average change in prices over time in a market basket of goods and services.
What would an item or service purchased in 2011 be worth in 1950 dollars?
Example:
The CPI is used to calculate how prices have changed over the years. Let’s say you have $7 in your pocket to purchase some goods and
$28,381
Based on the Consumer Expenditure Survey, www.census.gov
$32,264
$38,045
$46,409
  53
 Inflation—What Is a Dollar Worth?
$50,486
